
Figure 10. Effect of LPS Pre-stimulation on M.tb-induced mRNA Expression.
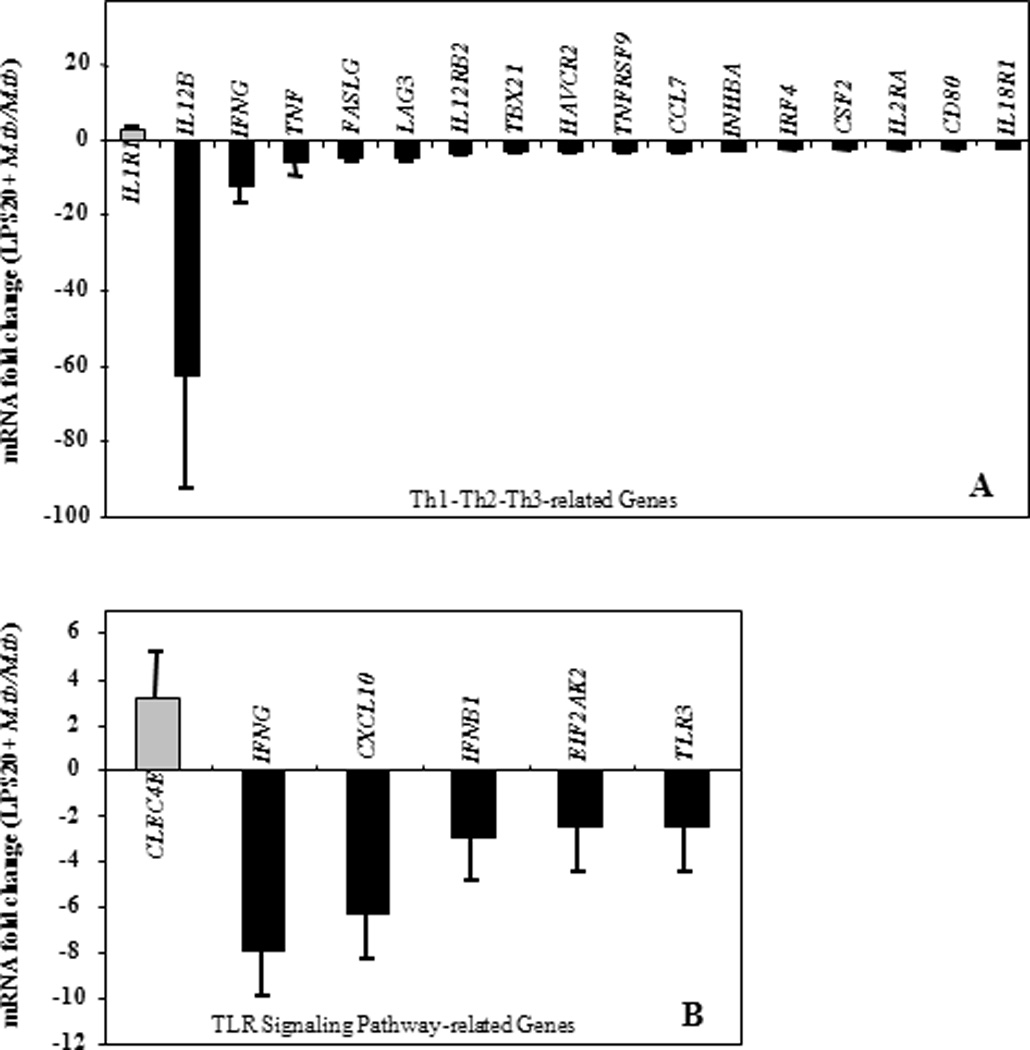
Depicted in y-axes are statistically significant (p ≤ 0.01) mean fold changes (≥ 2-fold) ± SEM in mRNA expression levels of in vitro-stimulated PBMC from healthy subjects (n=11 for Th1-Th2-Th3, n=8 for TLR pathway-specific qRT-PCR arrays). PBMC were pre-stimulated with LPS (100 ng/mL) for 20 hours and subsequently stimulated with M.tb at MOI 10 for an additional 24 hours. Following RNA extraction and generation of cDNA, gene expression was assessed by qRT-PCR arrays. mRNA expression levels were compared to that from PBMC stimulated with M.tb alone (set as 0-line). Panel A shows effects of LPS pre-stimulation on M.tb-induced Th1-Th2-Th3 pathway-specific mRNA Expression. Panel B shows effects of LPS pre-stimulation on M.tb-induced TLR pathway-specific mRNA Expression.