
Figure 3. Simultaneous Stimulation with DEP Alters Pathogen-induced Cytokine Production.
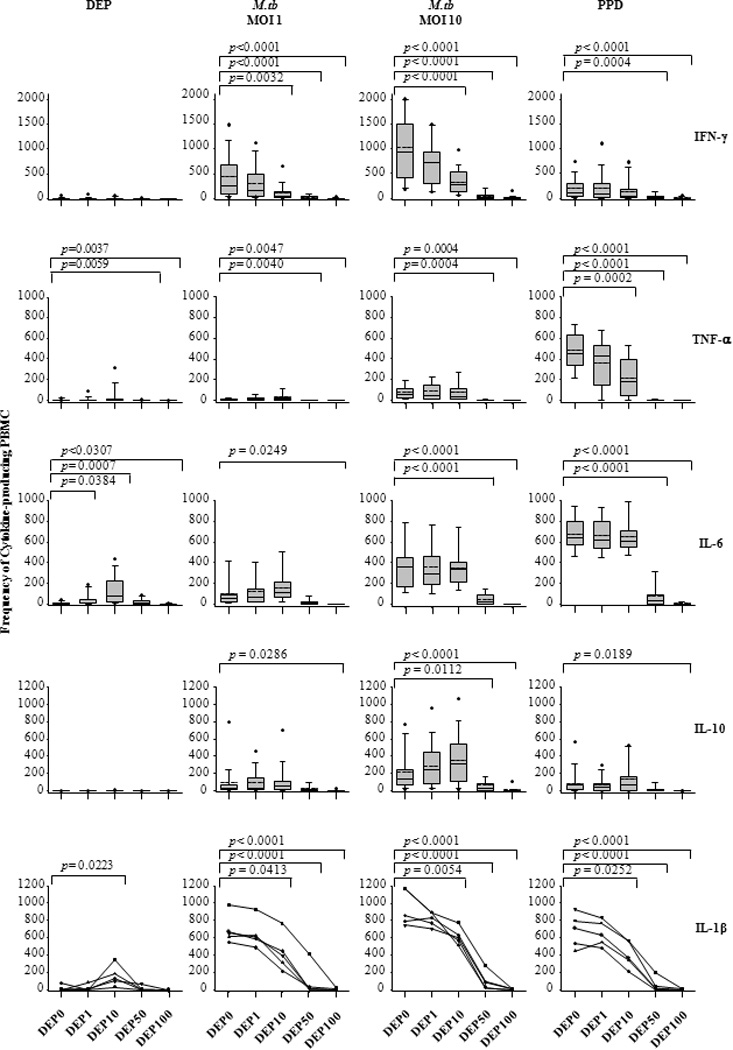
Frequencies of cytokine-producing PBMC (IFN-γ [n=20 subjects], TNF-α [n=18 subjects], IL-6 [n=15 subjects], IL-10 [n=20 subjects, data for DEP 50 µg/mL from n=18 only], and IL-1β [n=5 subjects]) stimulated with DEP alone (0, 1, 10, 50 and 100 µg/mL) or the stimuli M.tb MOI 1, MOI 10 and PPD (10 µg/mL) in presence (1, 10, 50 and 100 µg/mL) or absence (0 µg/mL) of DEP, were measured by ELISPOT assay. Cytokine data are arranged horizontally for each of the stimuli, which are arranged vertically. Frequencies of cytokine-producing cells (y-axes) are plotted as a function of DEP concentration in µg/mL (x-axes shown below the IL-1β panel only). Data are presented in box plots showing from top to bottom: the maximum value (black dot), the 95 (whisker), 75 (top of box plot), 50 (median, dotted line), mean (solid line in middle of box plot) 25 (solid line bottom of box plot), and 5 (whisker) percentiles and the minimum value (black dot). P-values are shown on top of box plots where differences in cytokine expression between no DEP and different doses of DEP were regarded to be statistically significant (p ≤ 0.05). Additional statistical comparisons are shown in supplemental Table S1.