
Figure 4. Simultaneous Stimulation with DEP alters LPS-induced Cytokine Production.
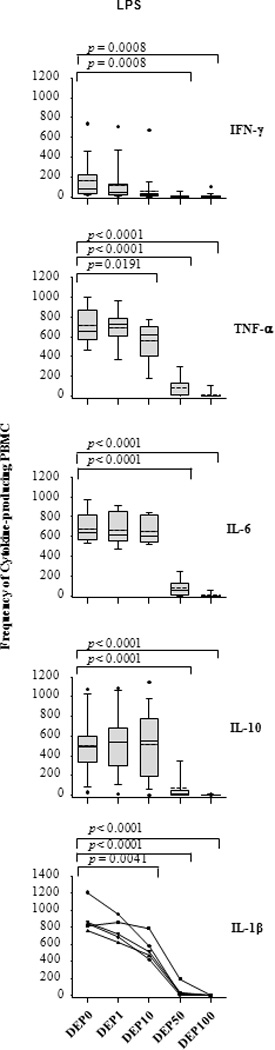
Frequencies of IFN-γ, TNF-α, IL-6, IL-10, and IL-1β-producing PBMC (y-axis) represent spot frequencies following stimulation with LPS in presence or absence of indicated amounts of DEP (0, 1, 10, 50 and 100 µg/mL) were measured by ELISPOT assay. Subject numbers, incubation time and cell numbers for each cytokine were identical to that stated in legend to Figure 3. Presentation of data in the box plots is described in Figure 3. Additional statistical comparisons are shown in supplemental Table S1.