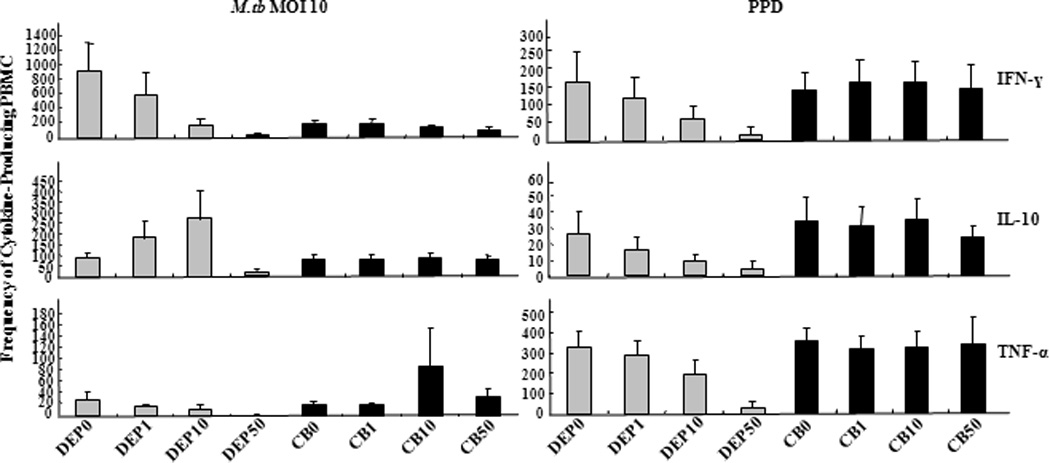
Figure 5. Comparison of DEP and Carbon Black Effects on M.tb- and PPD-induced Cytokine Production.

PBMC from healthy subjects (n= 3) were stimulated with M.tb at MOI 10 and PPD (10 µg/mL) in presence of varying doses of DEP or carbon black (CB). DEP or CB was added at final concentrations of 0 (DEP0, CB0, negative control), 1, 10, and 50 µg/mL. Numbers of IFN-γ, IL-10 and TNF-α-producing PBMC were enumerated by ELISPOT assay and frequencies of cytokine-producing cells (y-axes) are plotted as a function of DEP concentration in µg/mL (x-axes shown below the TNF-α panel only). Mean frequencies ± standard error of the mean is shown.
