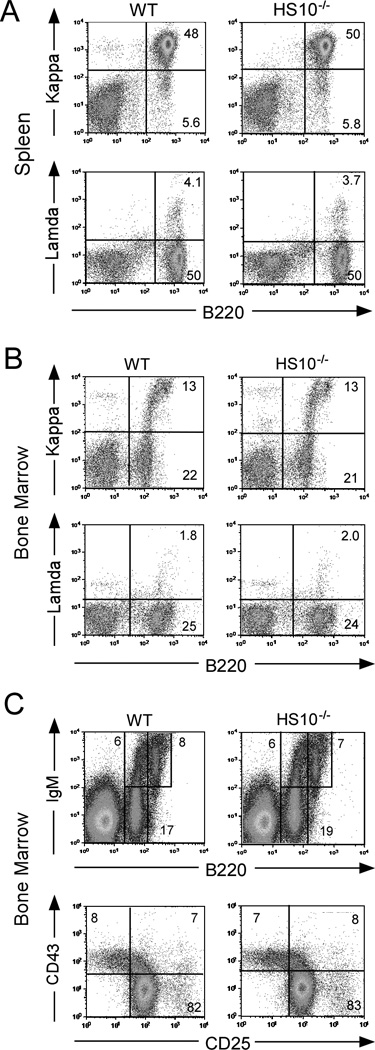
FIGURE 3.

Flow-cytometric analysis of cell surface Ig expression and B cell development in spleen and bone marrow. A, FACS analysis of cell surface Ig expression in WT and HS10−/− mice. Single cell suspensions from spleen were simultaneously stained with anti-B220 and anti-Igκ Abs (upper); or anti-B220 and anti-Igλ Abs (lower). Stained cells were analyzed by FACS. Only cells residing in the lymphocyte gate were analyzed. Percentages of cells residing in various windows are shown in the figure sub-panels. Data are representative of independent FACS analyses from at least 6 mice of each genotype. The percentages of Igκ+ B cells between HS10−/− and WT were not significantly different, n=6, p=0.88 Student’s t test, nor were the percentages of Igλ+ B cells, n=6, p=0.54, Student’s t test. B, FACS analysis of cell surface Ig expression in bone marrow of WT and HS10−/− mice. Single cell suspensions from bone marrow were stained and analyzed as described in Fig. 3A. The percentages of Igκ+ B cells between HS10−/− and WT were not significantly different, n=6, p=0.73 Student’s t test, nor were the percentages of Igλ+ B cells, n=6, p=078, Student’s t test). C, Four color FACS analysis of B cell development in bone marrow of WT and HS10−/− mice. Single cell suspensions from bone marrow were stained with anti-B220 and anti-IgM Abs to assay for mature B (B220highIgM+) and immature B cells (B220+IgM+) (upper right subpanels). There were no significant differences between these cell populations, n=6, p=0.63, Student’s t test, n=6, p=0.95, Student’s t test, n=6, p=0.47, Student’s t test. B220+IgM− cells were gated and their expression of CD25 and CD43 were analyzed (lower panels). Data are representative of independent FACS analyses from at least 6 mice of each genotype. There were no significant differences between these cell populations, n=6, p=0.71, Student’s t test, n=6, p=0.87, Student’s t test, n=6, p=0.72, Student’s t test.
