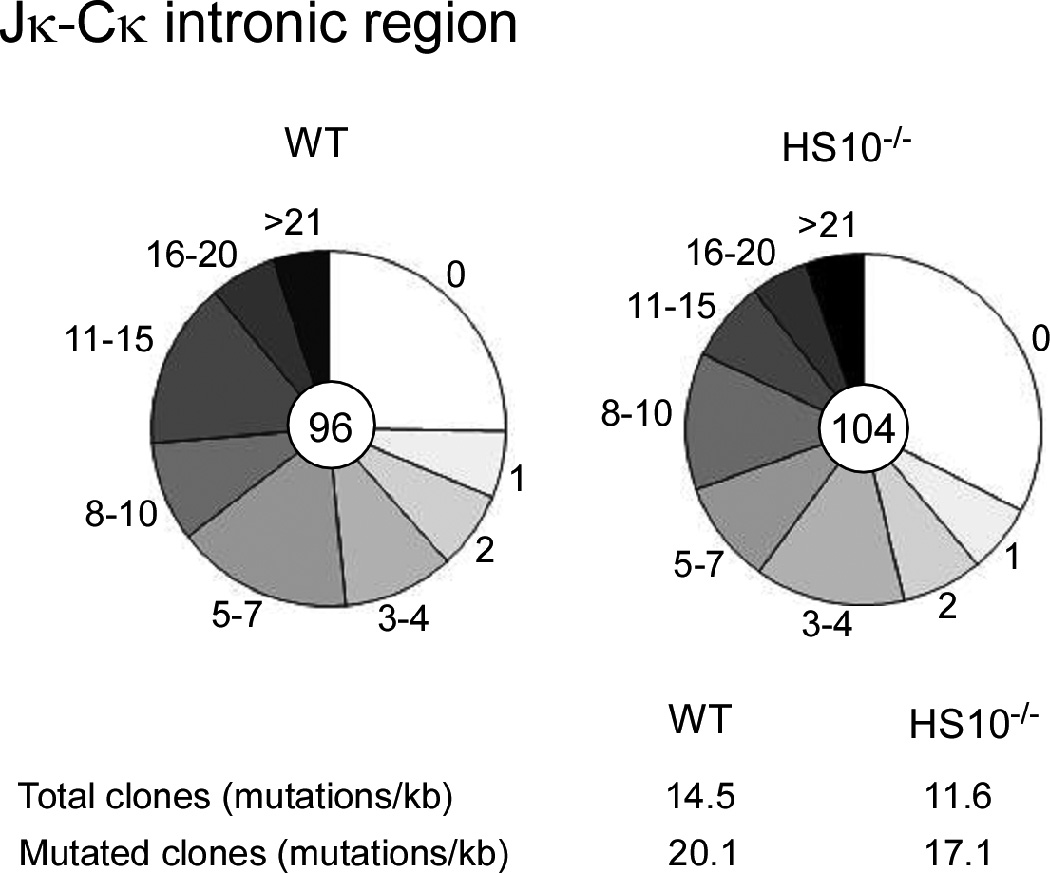
FIGURE 8.

Analysis of Igκ SHM in GC B cells. B220+PNAhigh GC B cells were sorted from 4–6-month-old WT (left) and HS10−/− (right) mice, and SHM in a 500 bp Jκ-Cκ region that is immediately 3' of Vκ-Jκ5 recombination products was analyzed. Each pie slice represents the proportions of sequences having the indicated numbers of mutations. The numbers of plasmid clones that were sequenced are shown in pie centers. The mutation frequencies from the total or mutated clones are shown at the bottom.
