
Figure 1.
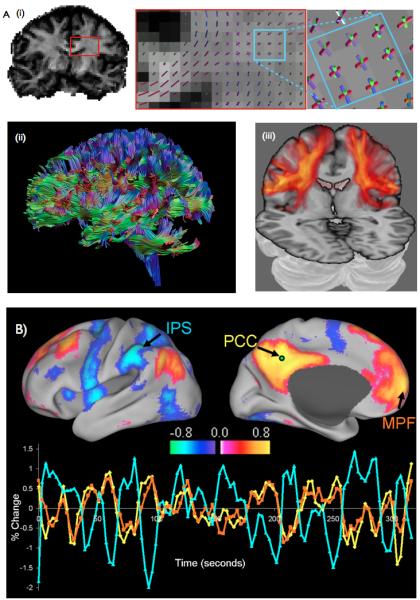
Measuring connections in the living human brain
- Measuring anatomical connections with diffusion imaging. (i) A map of diffusion anisotropy (left) reveals the orientational dependence on diffusion in white matter. Insets: The peak orientations of diffusion lie along coherent fibre bundles (middle). Complex fiber crossings can be resolved (right). For example here the corona radiata(blue/purple), callosal projections(red) and the superior longitudinal fasciculus (green) cross in the same voxels. (ii) Determinsitic tractography follows these peak diffusion orientations to reconstruct paths between distant brain regions. Image courtesy of Alexander Leemans. (iii) Probabilistic tractography reveals a distribution of probable connections from a single seed. Here, brighter and more opaque pixels display higher connection probability to ventral parietal region OP4. Image adapted from [17]
- Functional connectivity can be measured using resting fMRI. Here we show two networks whose regions reproducibly exhibit correlated resting activity – the default mode network (red) and the dorsal attention network (blue). Three example timeseries are shown. Medial prefrontal fluctuations (orange) exhibit high correlation with posterior cingulate fluctuations (yellow), but not with intraparietal fluctuations (blue). Image taken from [78].