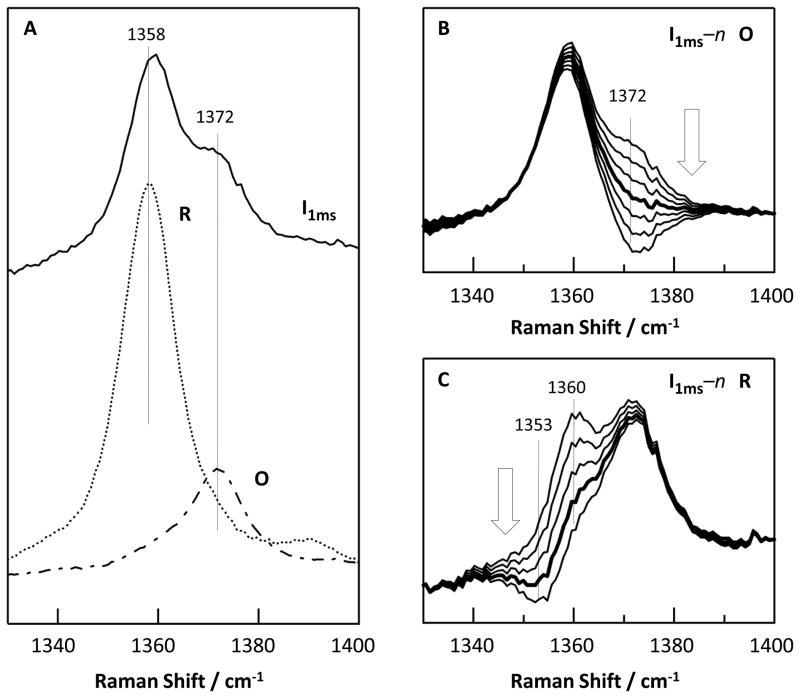
Figure 3.
The ν4 bands of the 1 ms intermediate state (solid line) as compared to the R (dotted line) and O (dot-dashed line) states of ba3 (A) and the simulated spectra obtained by subtracting increasing amount of the O or R spectrum from the 1 ms RR spectrum (as indicated by the arrows) (B–C). The thick line in (B) shows the best simulated spectrum with the spectral contribution from the O state totally canceled. The thick line in (C) demonstrates a shift of the ν4 band to higher frequency in the 1 ms spectrum with respect to that of the equilibrium R state.

