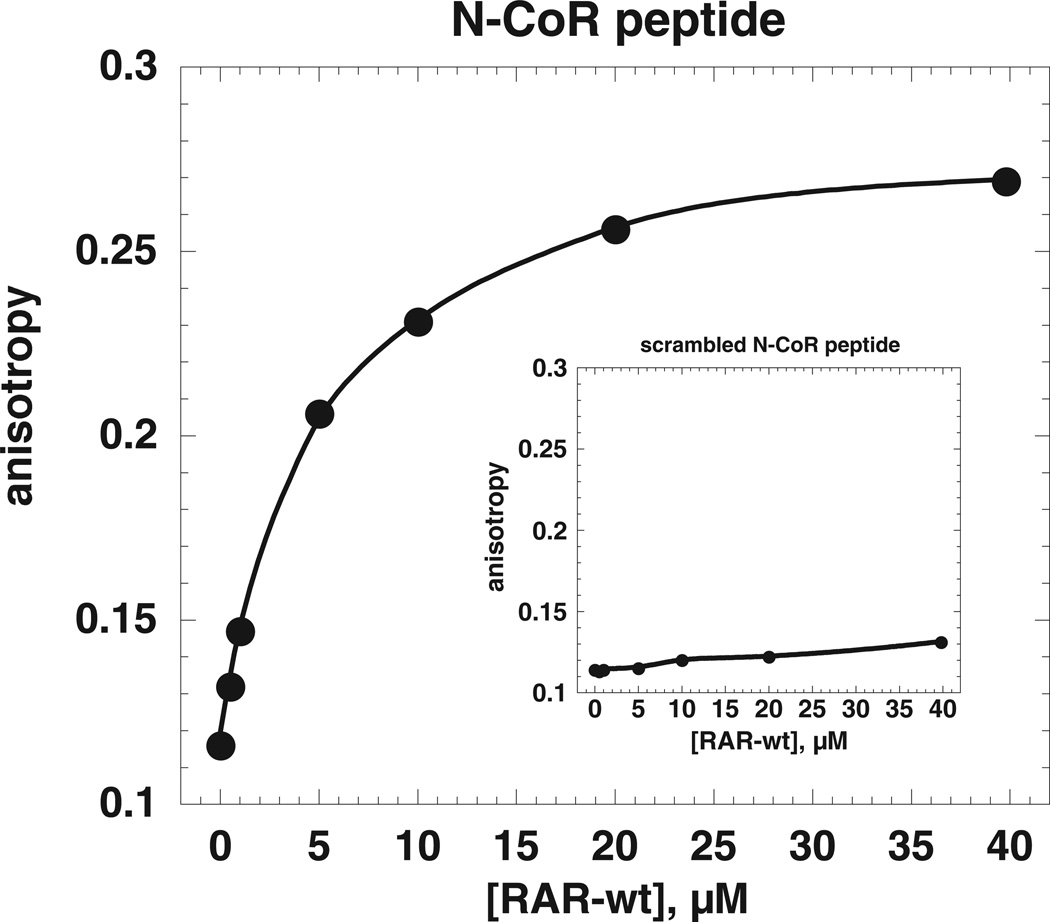
Figure 4. Fluorescence anisotropy assay used to measure peptide binding to RARα ligand binding domain.
The binding measurements were performed at 20 °C and pH 8.1, as described in “Materials and Methods”. All measurements were repeated with at least two independent protein preparations. The results from a representative experiment are shown. The main plot depicts an experiment with wild type RARα LBD and a peptide based on the sequence of the N-CoR nuclear co-repressor. The inset depicts a fluorescence anisotropy experiment employing a scrambled sequence of the N-CoR peptide as ligand.

