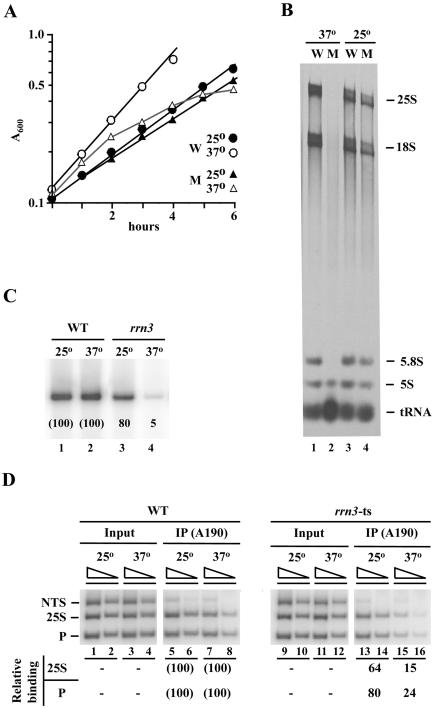
Figure 2.
A temperature-sensitive rrn3 mutation (S213P) decreases association of Pol I with the promoter at nonpermissive temperature. (A) Representative growth curves of the rrn3 (S213P) mutant (NOY1075; M) and the control RRN3 (NOY388; W) strains. Cells exponentially growing in SD complete medium at 25°C were divided into two, one shifted to 37°C (time 0) and the other kept at 25°C, and increases in cell density were followed. (B) CEN plasmid pRS316 was introduced into both NOY1075 (M) and NOY388 (W) to make them URA3. The resultant strains were grown as in A, and [3H]uridine was added at 2.5 h after the temperature shift and incubated for 1 h. Control cultures kept at 25°C were also treated in the same way. Aliquots were taken to determine the amounts of [3H]uridine incorporated into the total TCA-insoluble RNA fraction and the remaining cells were used to isolate RNA. RNA samples containing 1 × 10⁵ cpm 3H counts were analyzed by electrophoresis on a polyacrylamide/agarose composite gel. An autoradiogram is shown. The amounts of radioactive RNA corresponding to 25S, 18S, 5.8S, 5S, and tRNA were determined and the ratios of the sum of Pol I transcripts (25S + 18S + 5.8S) to the total (25S + 18S + 5.8S + 5S +tRNA) were calculated. These ratios and the amounts of [3H]uridine incorporated into total RNA were used to calculate the levels of Pol I transcription, yielding the values of 96 and 2.2% for the mutant relative to the wild-type (100%) at 25°C and 37°C, respectively. (C) Both the WT (NOY388) and rrn3 (S213P) mutant (NOY1075) strains were grown in YEPD at 25°C to a cell density of A600 0.2, and the cultures were divided into two, one shifted to 37°C and the other kept at 25°C. Three hours later, portions were used for ChIP analysis shown in D, and the remaining portions were used to isolate RNA. Primer extension analysis was carried out using equal amounts of RNA and the amounts of the 5′ end of 35S pre-rRNA were visualized and quantified by a PhosphorImager. The values normalized to the wild type (WT) at respective temperatures are shown below the radioactive bands. (D) Samples described above were subjected to ChIP analysis by using anti-A190 antibodies to determine the degree of association of Pol I with the promoter, the 25S coding region and NTS. PCR products were quantified by a PhosphorImager, and the values were normalized to those for input were first calculated as % Bound as described in Figure 1. Those values obtained for the rrn3-ts strain were then compared with the corresponding values obtained for WT and are shown as percentage of WT.

