
Figure 4.
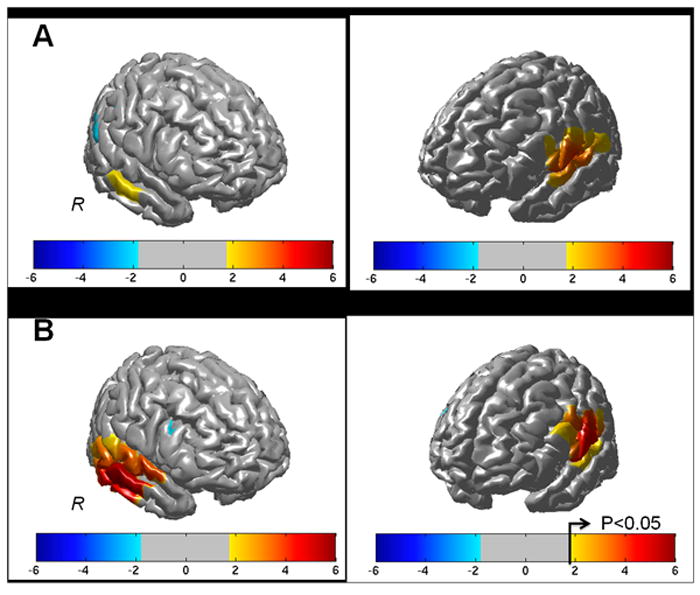
The effects maps (T-statistic) for the reconstructed group-level (N=9) oxy-hemoglobin changes are shown above for the beginner (panel A) and advanced (panel B) trial conditions. Regions near the left and right superior temporal gyrus were significantly activated (p<0.05 corrected) in both tasks.