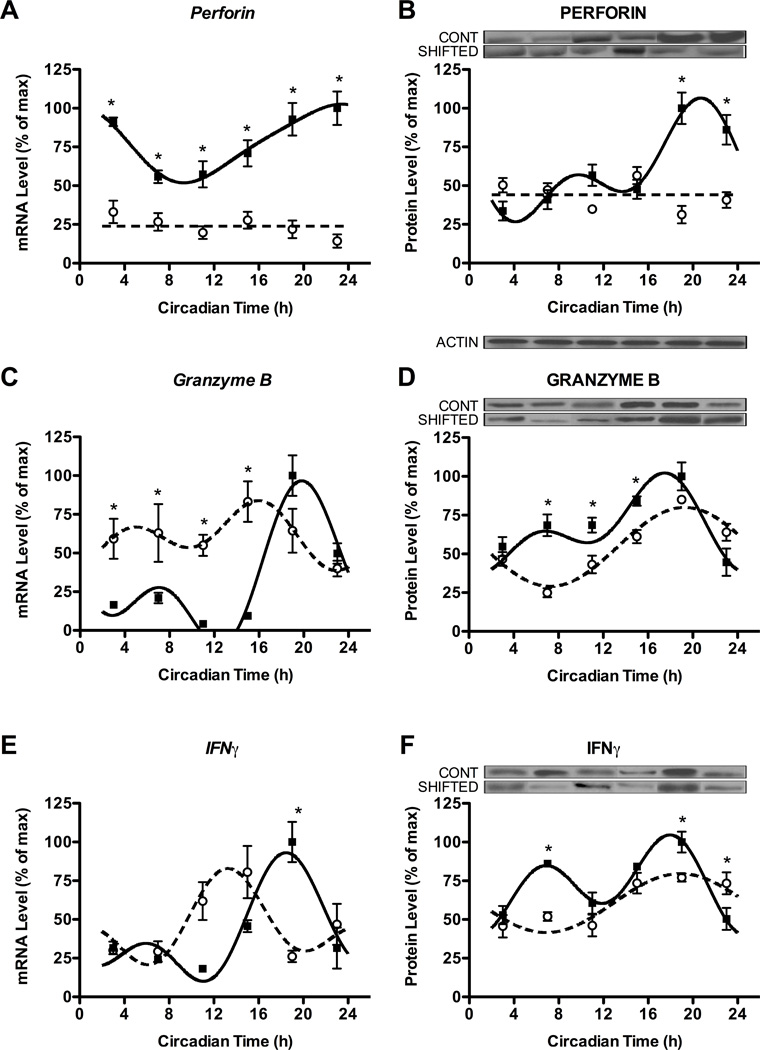
Figure 4. Chronic shift lag alters the circadian expression of cytokines and cytolytic factors in enriched NK cells.
Expression levels of genes (left) and proteins (right) for cytolytic factors perforin (A,B) and granzyme B (C,D), and cytokine IFNγ (E,F) in NK cells separated from animals at different time points in DD following either control or shifted paradigms. Representative immunoblots are shown above respective protein plots across all CTs. Densitometric quantification of protein levels was done by Image J software. Sine wave fits using linear harmonic regression with an assumed period of 24 h for control and shifted groups (solid and dotted lines, respectively) are superimposed with group means ± SEMs for each CT. Straight line (i.e., perforin) denotes no significant curve fit, and thus a complete lack of rhythm. All curve fits are significant (p < 0.01). *, p < 0.05, significant difference between groups at CT.

