
Figure 5.
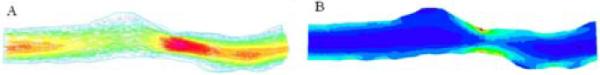
Flow velocity (A) and shear stress (B) in Coronary-1. Flow direction is left to right. Universal color scale in Figure 4 applies with respective maximum and minimum values of 39.2 cm/s and 0 cm/s for A, and 71.7 dyn/cm2 and 0.6 dyn/cm2 for B. The flow and shear stress distributions are similar to those predicted previously using parameters from uniaxial test data.