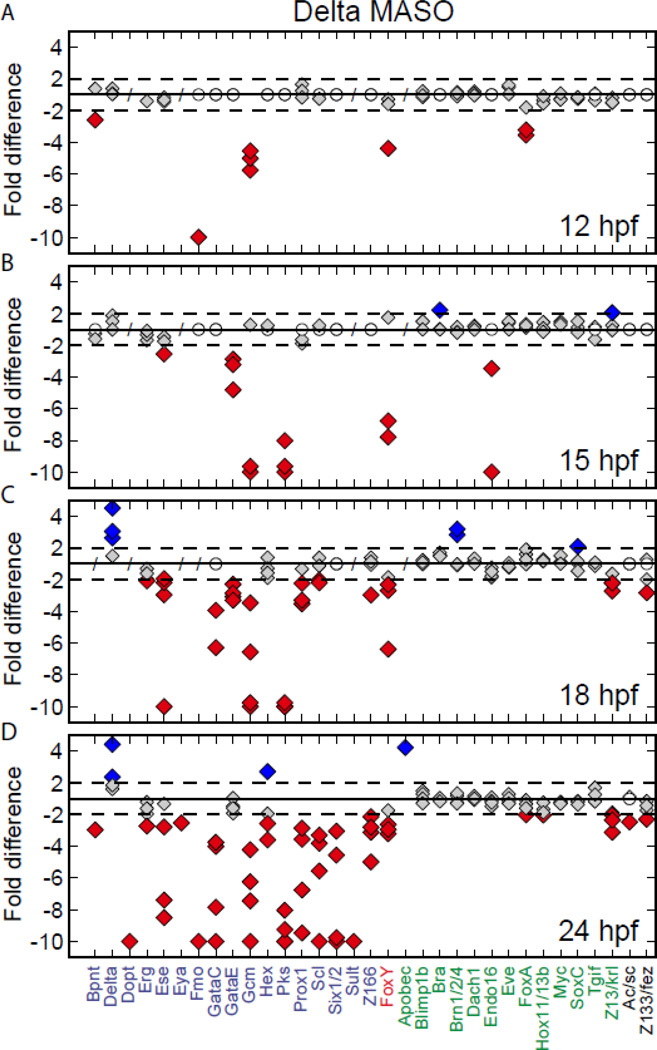
Figure 3.
Effect of Delta MASO treatment on transcript levels. Fold differences were calculated using the quantitative data obtained with the Nanostring nCounter and supplemented with QPCR data for genes not included in the codeset. Each diamond represents a single experiment. (A) The earliest gene affected by the perturbation is Gcm, a known, direct target in the mesoderm. The expression level of FoxY, a small micromere gene, is also affected at 12 hpf. The early Delta/Notch input into FoxA (12 hpf) is only transitory (see also Figs. 4A and 5A). (B) The transcription factor GataE and pigment cell differentiation gene Pks, which are both confirmed direct targets of D/N, have reduced expression levels at 15 hpf. Endo16 is strongly activated in endoderm at about 15 hpf but at this time its expression level is significant in only some experiments. The large fold change that is observed in a few experiments is thus due to the relatively big difference between small numbers of transcripts. As soon as it reaches a higher expression level, Endo16 is unaffected by D/N perturbations. (C) At 18 hpf three (oral) mesodermal genes (Ese, GataC, Prox1) have reduced expression levels in perturbed embryos, but whether they are direct Delta/Notch targets is unknown. (D) At 24 hpf essentially all mesodermal genes (purple labels) have strongly reduced transcript levels. In contrast, expression of endodermal genes (green labels) is impacted only minimally if at all. Apical genes (black labels) are only weakly perturbed. Delta MASO treatment causes increased delta expression levels at 18 and 24 hpf. Perturbations affecting the reception of the Delta signal do not cause a similar effect (compare to Figs. 4D, 5D, 7A). Thus, Delta protein itself must contribute to the regulation of Delta transcript, presumably in the SM cells as these are the cells from which Delta is cleared at this time. Dashed lines indicate a significance threshold of 2-fold difference. Genes that are expressed at about 50 molecules or less per embryo are considered insignificant and marked with an open circle. Genes that were not evaluated are marked with a slash (/). For presentation purposes fold differences bigger than 10 fold are shown as 10 fold. A table with all perturbation data is provided as Supplemental Material.

