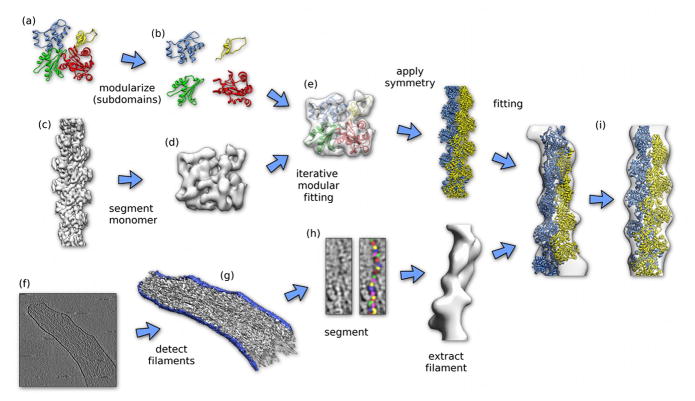
Figure 1. Schematic workflow for correlating atomic-level information with large, dynamic cellular structures. As an example, we place actin atoms into a cellular, actin-rich protrusion of a mouse embryonic fibroblast [71].
A. Structure of actin obtained by X-ray crystallography [96] (pdb accession code: 1atn).
B. Modularization of the structure into the four sub-domains.
C. Density of actin filament at 0.7-nm resolution [15**] (emdb accession code: emd_5168).
D. Single actin monomer density segmented from the filament density using the model-free, three-dimensional watershed procedure [97].
E. Iterative modular fitting [50**] of the actin subdomain structures into the monomer density segmented from the electron microscopy reconstruction of filamentous actin.
F. Slice through a tomogram of an actin-rich protrusion of a mouse embryonic fibroblast [71].
G. Template-based automatic segmentation of tomogram shown in F.
H. Watershed-based, template-free segmentation of filament extracted from tomogram shown in F using a mask derived from G. Note that single actin monomers can be segmented from the density.
I. Result of fitting the actin filament atomic model derived in E into the filament density extracted from the cellular tomogram in F-H. The left hand side shows the fit into the unprocessed extracted density. The right hand side shows the fit after the actin symmetry was applied to the extracted density. Comparison of the symmetrized density with the atomic model indicates a resolution of about 0.4 nm.

