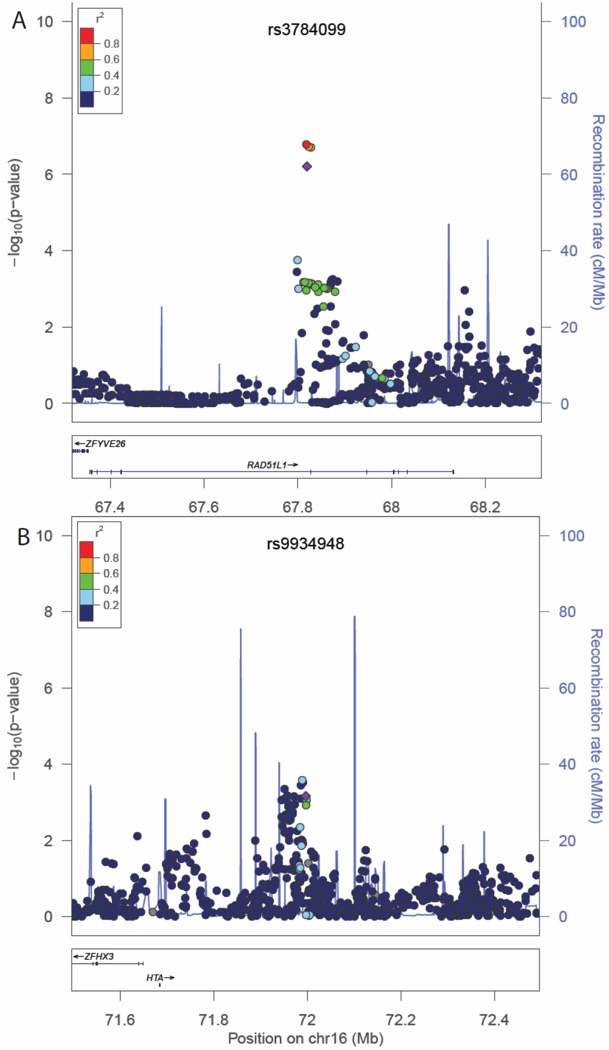
Figure 1.
Regional association plots for total mortality in association with rs3784099 (panel A) and rs9934948 (panel B). Regional association plots for total mortality in association with rs3784099 (panel A) and rs9934948 (panel B). Chromosomal position is given on the X axis and the association P-values (−log10 P) on the Y axis. Referent SNPs are identified with purple diamonds and pairwise linkage disequilibrium with adjacent SNPs as measured by r2 values (according to the HapMap 1000 Genomes June 2010 CHB+JPT data) is indicated with the color of each circle. Refseq genes are shown beneath each plot.

