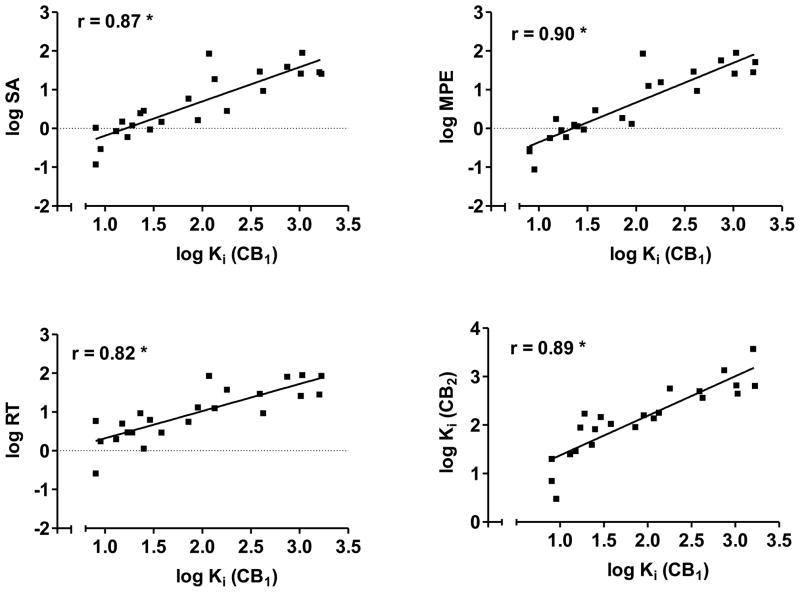
Figure 2.
Scatterplots and regression lines for CB1 affininities (log Ki) plotted against log ED50 for each of the three in vivo tests (SA = spontaneous activity, top left panel; MPE = % maximum possible antinociceptive effect, top right panel; RT = change in rectal temperature, bottom left panel). The bottom right panel shows scatterplot and regression line for the relationship between CB1 and CB2 binding affinities (log Kis). Pearson product-moment correlations are shown for the two measures graphed in each panel. * indicates significant correlation (p<0.05).

