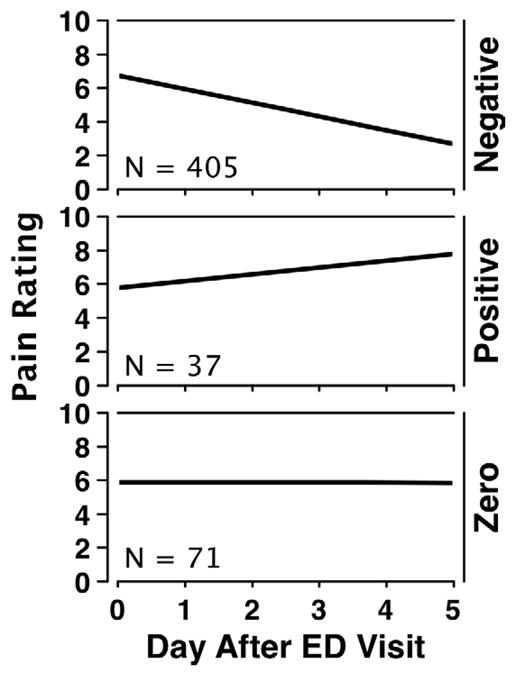
Figure 3.

Mean acute pain trajectories in three subgroups. The upper panel displays the mean acute pain trajectory for the subgroup of patients with negative slopes who eventually resolved their pain. The middle panel shows the mean acute pain trajectory for those patients whose pain worsened after ED discharge. The bottom panel provides the mean acute pain trajectory for the patients whose pain stayed the same for six days after discharged from the ED.
