
Figure 1.
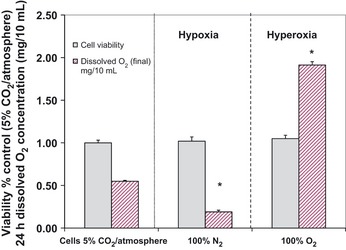
Toxicity profile of N2a cells in response to hyperoxia or hypoxia at a sustained pericellular pH 7.2. The data represent cell viability (% control) and dissolved O2 concentration (mg/10 mL) of the media after 24 h incubations at 37°C. Significance of difference between the control (5% CO2/atmosphere) and N 2 (hypoxic conditions) or O 2 (hyperoxic conditions) treated groups were determined by a one‐way anova followed by Tukey's post‐hoc test. *P < 0.01.