
Figure 2.
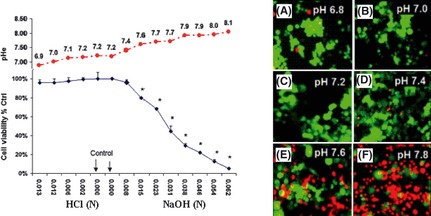
Toxicity profile of N2a cells in response to variation in pericellular pH (pHe) after 24 h incubation. The data represent viability (% control) (left panel) determined using almar blue assay and are presented as the mean ± SEM, n = 4. Corresponding pHe is presented and significance of difference between toxicity in controls versus treatment was determined by a one‐way anova followed by Tukey's post‐hoc test. *P < 0.01. Dual detection with fluorescence microscopy overlay was used as confirmation (right panel), where viable cells were imaged with fluorescein diacetate (green) and non‐viable cells using propidium iodide staining (red). pHe (A) 6.8, (B) 7.0, (C) 7.2, (D) 7.4, (E) 7.6 and (F) 7.8.