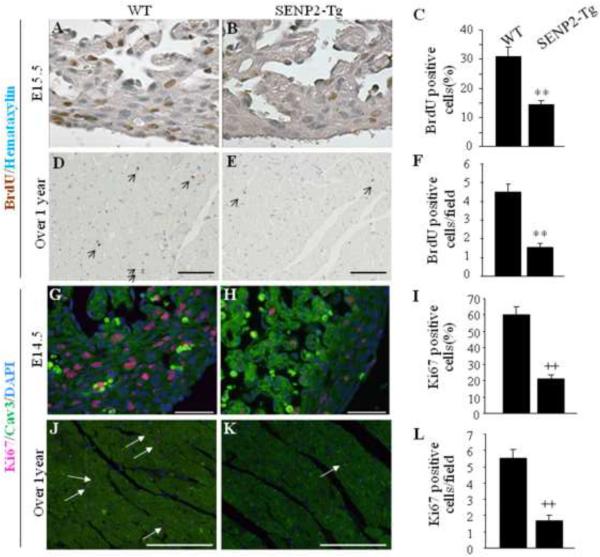
Figure 6. Defect in cardiomyocyte proliferation in SENP2-Tg mice.
A–C: DNA synthesis of cardiomyocyte was decreased in SENP2-Tg mice at E15.5 embryonic stage. Representative data from BrdU staining on E15.5 heart sections (A–B) and statistical analysis (C) are shown. Statistics in C represents the scores of 100 cells per section. A–B, 40× magnification. n=3 per group. **, p<0.001. D–F: SENP2-Tg mouse hearts exhibited decreased BrdU positive cardiomyocytes at age of over one year. Representative BrdU staining of heart sections from aging WT and SENP2-Tg mice (D–E) and statistical analysis (F) are shown. Scale bar, 100 μm. Statistics in F represents the scores of 5 randomly selected fields per section. D–E, 20× magnification. n=3 for each group. **, p<0.001. G–I: SENP2-Tg mouse hearts exhibited decreased Ki67 positive cardiomyocytes at E14.5 embryonic stage. Representative data from Ki67 staining on E14.5 heart sections (G–H) and statistical analysis (I) are shown. Statistical analysis in panel I represents the average scores of 100 cells per section. G–H, 40× magnification. Scale bar, 50μm. ++, p<0.001. J–L: SENP2-Tg mouse hearts exhibited decreased Ki67 positive cardiomyocytes at age of over one year. Representative data from Ki67 staining on sections of aging WT and SENP2-Tg hearts (J–K) and statistical analysis (L) are shown. Statistical results in L represent the scores from at least four randomly selected fields per section. J–K, 20× magnification. n=3 per group. ++, p<0.001. Arrows in D, E, J and K indicate BrdU (panel D–E) or Ki67 (panel J–K) positive cells.

