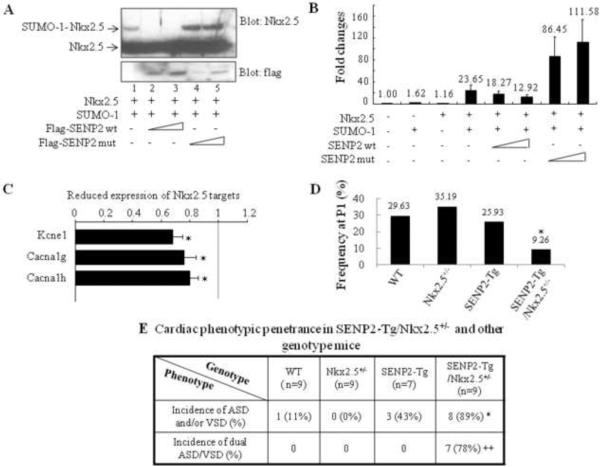
Figure 9. Functional interaction between the SUMO pathway component, SENP2, and Nkx2.5.
A. SENP2 wt, but not the catalytic mutant, deconjugated SUMO-1-Nkx2.5 conjugates. Sumoylation assays were performed on HeLa cell extracts containing overexpressed proteins, as indicated. Upper panel: blotted with anti-Nkx2.5 antibody to detect both free and conjugated Nkx2.5 (arrows); lower panel: blotted with anti-flag antibody to detect SENP2 wt and mutant. B. SENP2 wt, but not the catalytic mutant, suppressed Nkx2.5 activity in a dose-dependent manner. Transactivation assays were performed on HeLa cells transfected with the ANF-Luc construct together with single or combined expression of vectors, as indicated. Relative activation level (fold change) was calculated based on the luciferase activity of the control (empty vector alone), which was taken as 1. The dosage for each of those expression vectors were used as follows: Nkx2.5: 0.5 μg; SUMO-1: 0.75 μg; SENP2 wt: 50 and 100 ng; SENP2 mutant: 50 and 100 ng. The number shown above each bar indicates the fold change of the luciferase activity of that particular group. C. Down-regulation of a number of Nkx2.5 target genes in SENP2-Tg hearts was shown in comparison with those of WT hearts. The microarray assays of RNA samples from E16.5 SENP2-Tg and WT hearts were performed as described in the Materials and Methods. n=3 per group, with each sample carried out in duplicate. D–E. SENP2-Tg/Nkx2.5+/− mice exhibited a lower P1 frequency (D) and a higher incidence of cardiac defects, including the dual ASD/VSD phenotype (E), compared with those of single Nkx2.5+/− and SENP2-Tg mice. Mice were obtained from crossbreeding between SENP2-Tg mice of line #2839 and Nkx2.5+/− mice. The data were then compiled from 13 litters comprising a total of 75 animals (D) and from 7 litters comprising a total of 34 embryos with developmental stages ranging from E16.5 to E17.5 (E). The total animal number (n) of each genotype group analyzed in E was shown. Chi-square test was used for statistical comparison. *, p<0.05; ++, p<0.005.

