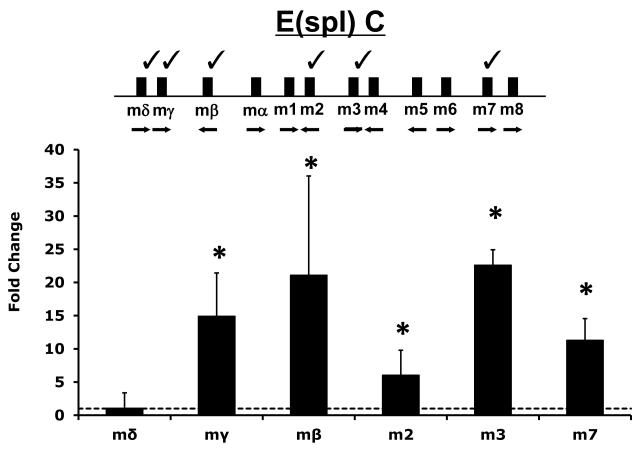
Figure 1. E(spl) gene expression in Delta ligand induced Notch signaling.
Organization of the Enhancer of split (E(spl)C) locus is diagramed and select genes analyzed in this study are indicated with a “check mark”. Delta induced E(spl) expression was determined with a previously described co-culture assay (Delwig and Rand, 2008). Briefly, S2 cells stably expressing the Notch ligand Delta (Dl-S2 cells) or control S2 parent cells lacking the ligand were cultured as a monolayer then stabilized through brief fixation. C6 cells, which express Notch endogenously, but not the Delta ligand, were then co-cultured with either the fixed Dl-S2 cells or control S2 cells. E(spl) gene expression was measured via qRT-PCR. Data represent the fold change in E(spl) expression in C6 cells due to Delta exposure, Error bars indicate standard deviation. (n=6 (m2, m3, m7, mδ) to 12 (mβ and mγ) independent experimental determinations, * = p<0.01 by Student’s t-test).

