
Figure 2.
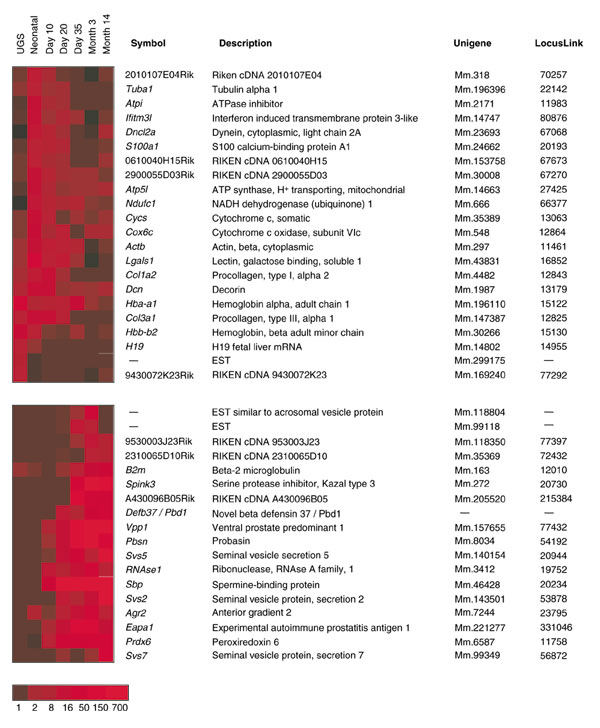
Differential gene expression during mouse prostate development. Statistical analysis of transcript abundance levels in stages of mouse prostate development identified 69 differentially expressed genes (p = 0.001). Shown are cohorts with progressing or regressing levels over time. The intensity scale represents the fold-change in expression normalized relative to the lowest abundance measurement.