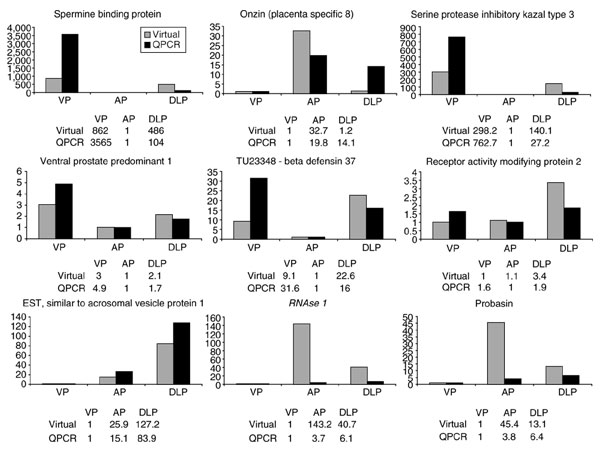
Figure 4.

Comparative analysis of fold change of gene expression in adult prostate lobes using quantitative PCR (QPCR) (dark grey bars) and virtual EST measurements (light gray bars).

Comparative analysis of fold change of gene expression in adult prostate lobes using quantitative PCR (QPCR) (dark grey bars) and virtual EST measurements (light gray bars).