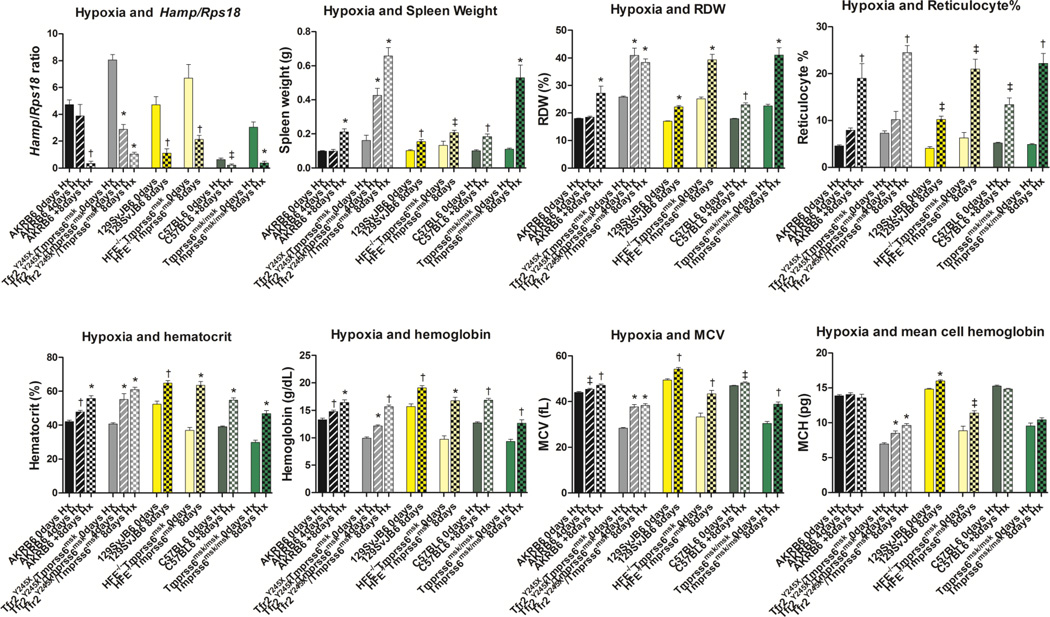
Figure 2.
Response to hypoxia by control and mutant mice. Homozygous Tfr2 Y245XTmprss6 msk double mutant, Hfe −/−Tmprss6 msk double mutant, Tmprss6 msk single mutant mice and their respective control strains were exposed to 4 or 8 days of 8% oxygen under normal pressure. For each group, n≥4, approximately equal numbers of males and females. The effect on hepcidin gene (Hamp) expression, spleen weight and hematological indices were determined as previously described [26]. Means and standard errors are shown. Statistical significance was determined using Mann Whitney test (GRAPHPAD Prism 5.0). * P≤0.0005; † P≤0.005; ‡ P≤0.05.

