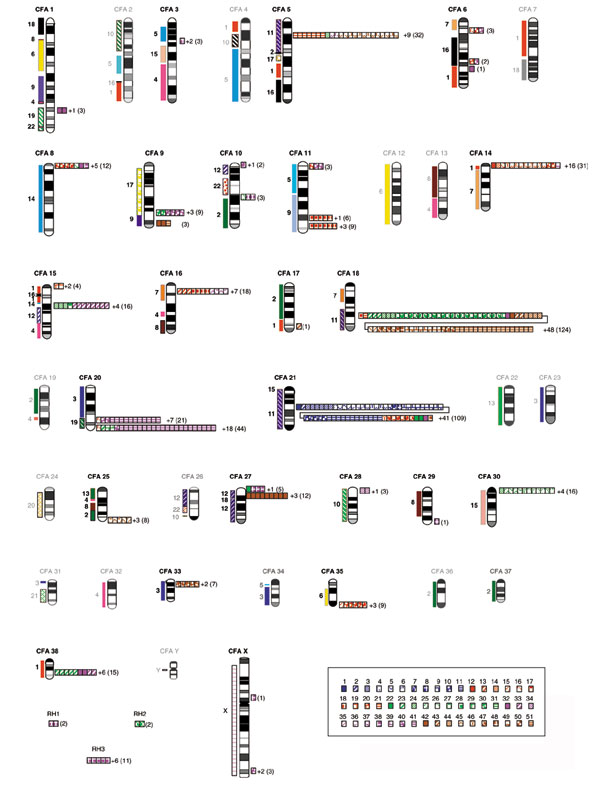
Figure 1.

Chromosomal distribution of canine OR sequences from RH mapping data. Human conserved syntenic regions, according to RH data [29], are indicated on the left of the canine chromosome ideograms (CFA 1-38, X, Y). On the right of each canine chromosome, canine OR genes are represented by colored squares, each color corresponding to a family. Numbers of non-classified ORs are indicated on the right of each localization, followed by, in parenthesis, the total number of OR sequences in each cluster.
