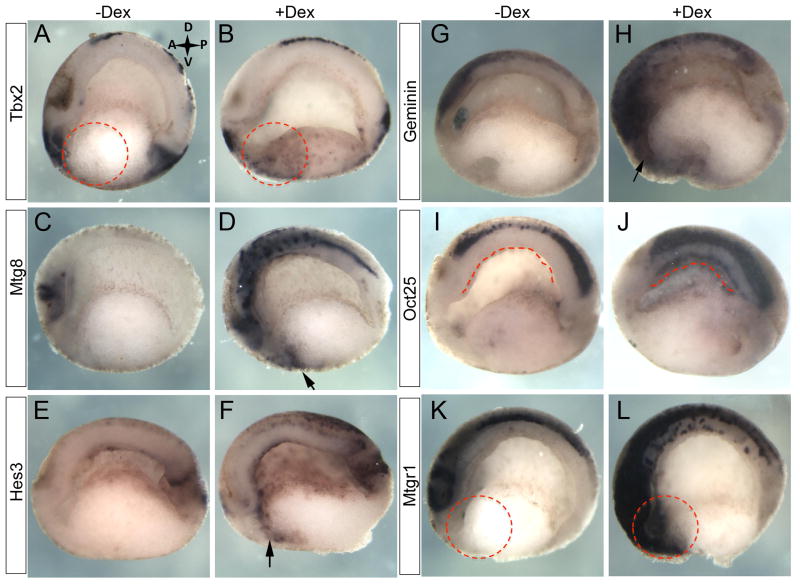
Fig. 8. Validation of microarray data.
Following 4 hours of Ngn3-GR activation at stage 12 candidate genes from the microarray analysis were increased in the endoderm at stage 15: (A,B) tbx2 (n=24/24). (C,D) mtg8 (n=21/21). (E,F) hes3 (n=14/42). (G,H) geminin (n=13/44). (I,J) oct25 (n=13/13). And at stage 20: (K,L) mtgr1 (n=9/13). Dashed circles and arrows indicate ectopic expression in the anterior endoderm. Dashed line indicates ectopic expression in the dorsal endoderm.

