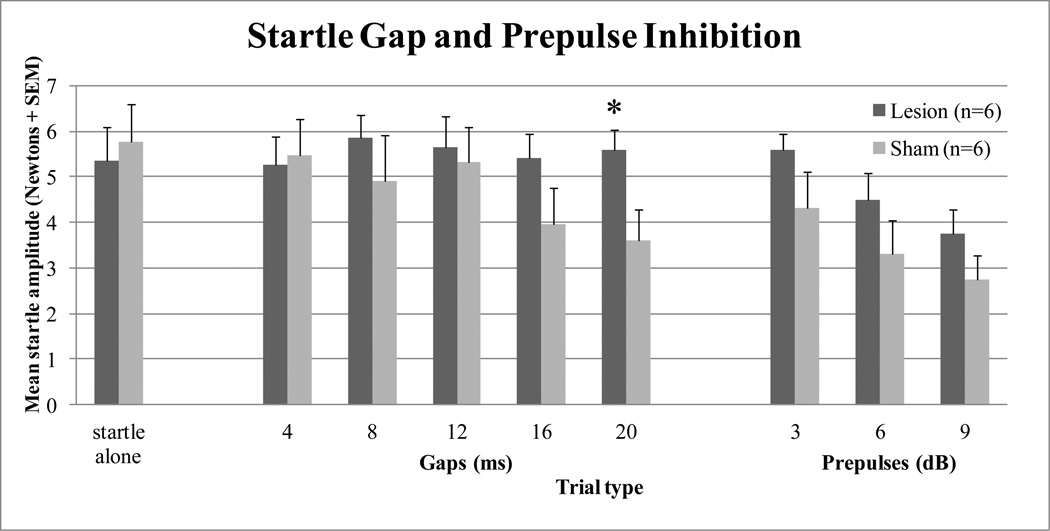
Figure 5.
Graph showing mean amplitude startle (Newtons +SEM) for sham-operated control and auditory cortex lesioned rats by trial type. Depicted are startle alone (105 dBA noise) trials, noise gap inhibition trials (4, 8, 12, 16, and 20 ms gaps), and prepulse inhibition trials (3, 6, and 9 dB above background noise levels). * Auditory cortex lesioned group significantly different from sham-operated group, p = 0.036.

