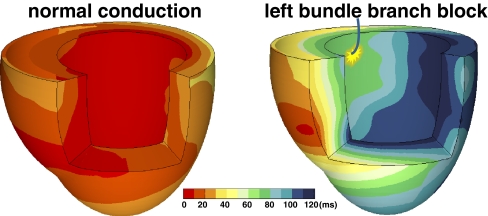
Fig. 1.
Typical examples of 3D electrical activation in canine hearts during normal conduction (left panel) and after creation of left bundle branch block (right panel). Each electrical activation map is reconstructed using a single-beat recording of simultaneous epicardial and endocardial electrical mapping. Epicardial potentials were derived using electrode bands placed around the heart, containing over 100 contact electrodes while the LV endocardium was mapped using custom-made plunge electrodes [63]. Early activated regions are indicated by a red color (close to 0 ms) and late activation regions are indicated by a dark blue color (over 100 ms), see color bar. Reproduced with permission [8]

