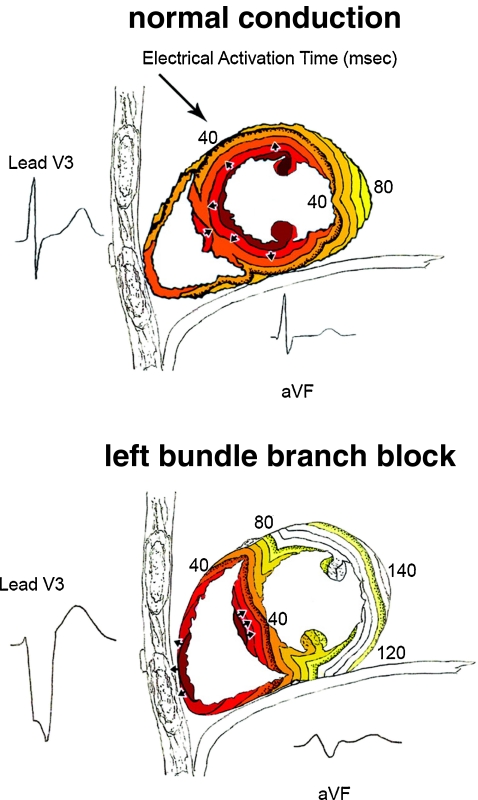
Fig. 2.
Timing of electrical activation (depolarization) wavefronts in normal conduction and during LBBB shown in sagittal view. For reference, two QRS-T waveforms are shown in their anatomic locations (V3 on the chest and aVF inferiorly). Electrical activation starts at the small arrows and spreads in a wavefront with each colored line representing successive 10 ms. In normal conduction, activation begins within both the LV and RV endocardium. In LBBB, activation only begins in the RV and must proceed through the septum before reaching the LV endocardium. Reproduced with permission [64]

