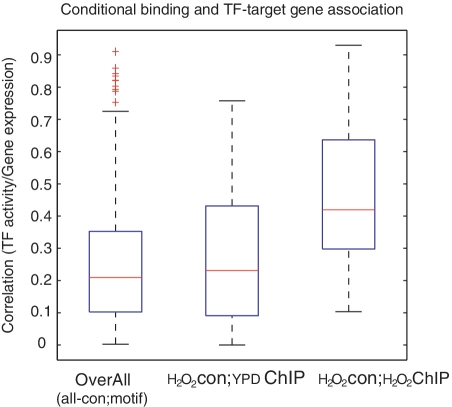
Figure 4:
Box plots of the average correlation between activity of the TFs and the expression of the target genes. A total of 596 1-to-1 TF–target gene pairs are considered. The activity of TFs is estimated by Type-2 model, all 1-to-1 pairs used in model assessment are excluded in the development of the Type-2 model. CHIP-chip data are not available for every TF, so only 99 pairs have binding information and 20 of them are conditional-specific binding. The overall gene–TF (box on the left) describes the average correlation of all 596 pairs under all conditions. To estimate the activity of the TFs, target genes of each TF are determined by yeast transcriptional regulatory network, where the TF–gene interactions are based on motif/binding site. Under the H2O2 condition, the box in the middle (YDP-CHIP) uses the unconditional binding (CHIP-chip results under normal condition) to determine both the activity of TFs and the average correlation of the gene–TF pairs that actually bind, and the box on the right uses conditional binding CHIP-chip data. The average TF–gene correlation increased significantly when conditional binding data were available (box on the right, P < 0.05 compared with the box on the left).

