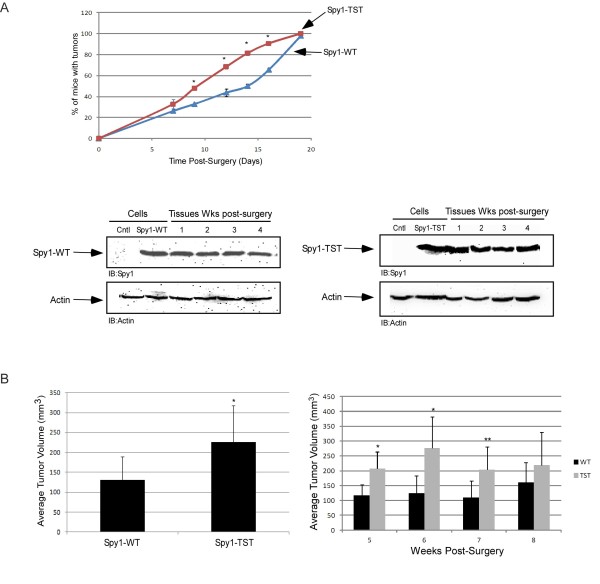
Figure 3.
Spy1 stable protein accelerates tumorigenesis in vivo.(A) Percentage of mice presenting with palpable tumors from 0-19 days post-transplant. Each data point represents 4 mice per indicated construct. The entire experiment was repeated three times using three independently derived overexpressing cell lines for each construct. Mann-Whitney Test was performed (p < 0.05). (A; lower blot) Western blots were conducted to measure the stability of Myc-Spy1-WT (left) and Myc-Spy1-TST (right) from representative time points. Empty vector control (Cntl) cell expression levels of Spy1 are seen in lane 1 of each blot. (B) Total tumor volume was calculated for both Spy1-HC11 (Spy1-WT) and Spy1-TST-HC11 (Spy1-TST) transplanted glands. Results were taken from 45 transplants using cells from 3 separate transfections. Error bars reflect SE between transplants from different transfections. Left hand panel reflects overall volume, right hand panel reflects volumes of tissues taken over a month post-transplant.

