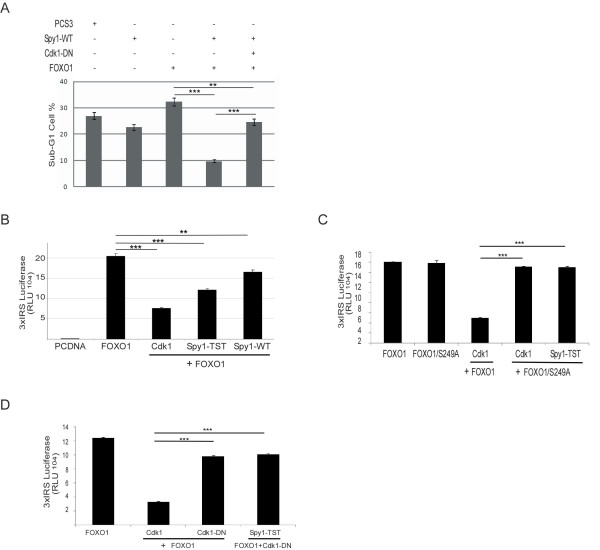
Figure 6.
Spy1 inhibits FOXO1 induced apoptosis through Cdk1 activation.(A) Flow cytometry analysis was conducted using no less than 100,000 transfected 293 cells per data point. Percentage of cells in each phase was determined by CPX analysis. Graphical representation of the overall percent of cells from each treatment harboring a DNA content less than G1 (sub-G1) (flow data presented in Additional file 2: Figure S2A). Error bars reflect SEM between 3 separate transfections. (B-D) Luciferase reporter activity for FOXO1 in cells expressing the indicated constructs. (B) Errors bars reflect SE. ANOVA with post-hoc Bonferroni correction was performed ** P < 0.01, ***P < 0.001. n = 3. (C-D) Error bars reflect SE of triplicate transfections within one representative experiment. ***P < 0.001. n = 2.

