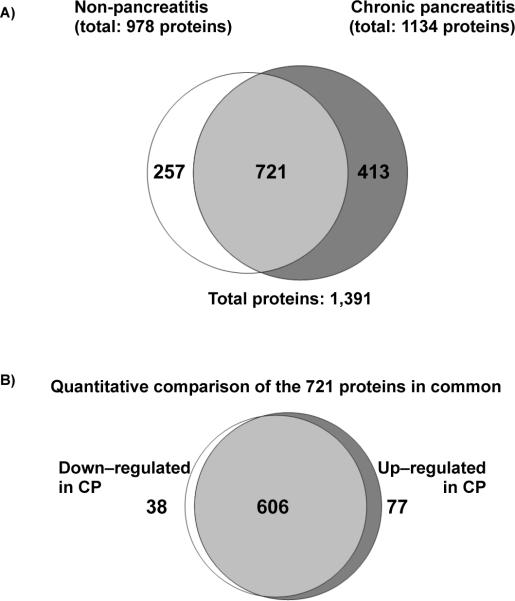
Figure 4.
Venn diagrams comparing proteins identified in the NP (non-pancreatitis) and CP (chronic pancreatitis) cohorts. A) Qualitative assessment of proteins in each cohort, depicting those exclusive to either cohort. B) Quantitative assessment of proteins in common between the two cohorts. Bayes factor ≥ 10 indicates a statistically significant difference of the protein between the two cohorts.

