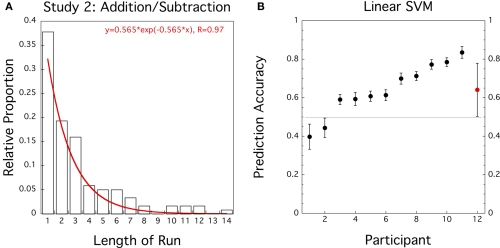
Figure 2.
Study 2 (N = 12): addition/subtraction in delayed intention task. (A) Histogram for proportion of length of response runs pooled across participants. Superimposed in Red is the best fitting exponential distribution function. (B) Prediction accuracies of linear SVM trained on preceding and current responses for individual data sets (black circles, error bars = ± 1 SD bootstrapped) and group average (red circle, error bar = ± 1 SD).

