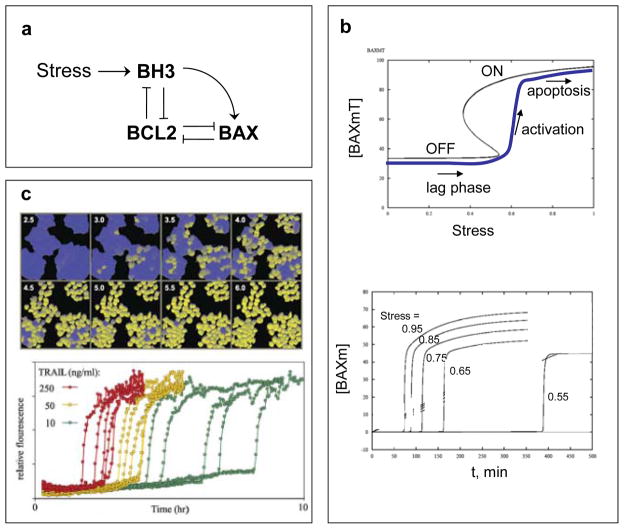
FIGURE 3. Bistable switch controlling apoptosis in mammalian cells.
a | Wiring diagram. Programmed cell death is triggered by activation of BAX proteins in the outer membrane of mitochondria. Active BAX causes the membrane to become permeable to proteins, such as cyctochrome C and SMAC, which induce the activation of proteases (caspases) and other hydrolytic enzymes that disassemble the macromolecules of the cell. BAX is activated by BH3-family proteins and kept inactive by binding to BCL-family proteins. BH3 proteins also bind to BCL proteins55. b | Signal-response curve. A mathematical model of the wiring diagram is presented in supplementary information S2 (Box). Top: steady-state concentration (black curve) of total membrane-bound BAX, [BAXm]T = [BAXm] + [BAXm:BCL2], as a function of [Stress]. For intermediate levels of Stress, the network has two stable steady states: an OFF state with low total level of BAXm, all of it complexed to BCL2 (i.e., [BAXm] ≈ 0); and an ON state with high total level of BAXm, most of it un-complexed to BCL2 (i.e., [BAXm] ≈ [BAXm]T). Bottom: time-course of active BAX. Each simulation is started in the naïve state: no stress, low level of BH3, [BAXm] ≈ 0. At t = 0, [Stress] is raised to a final value that varies (from one simulation to the next) from 0.55 to 0.95. The time-course for final [Stress] = 0.95 is plotted as the blue curve on the upper graph. Notice that, in each simulation, there is a long lag time followed by an abrupt activation of BAX (and subsequently an irreversible activation of caspases). The duration of the lag phase is a decreasing function of [Stress]. c | Experimental verification in HeLa cells (cervical cancer cell line); from Albeck et al.51, used by permission. Top: Cells are treated with 50 ng/ml TRAIL (TNF-related apoptosis-inducing ligand) and assayed for caspase activity by cleavage of an artificial substrate manufactured by the cell. Cells with high caspase activity are pseudo-colored yellow. Notice the long lag time before caspases are activated in any cells, then individual cells activate caspases abruptly, but there is a wide dispersion of activation times among cells. Bottom: traces of caspase activity in single cells activated by different concentrations of TRAIL.

