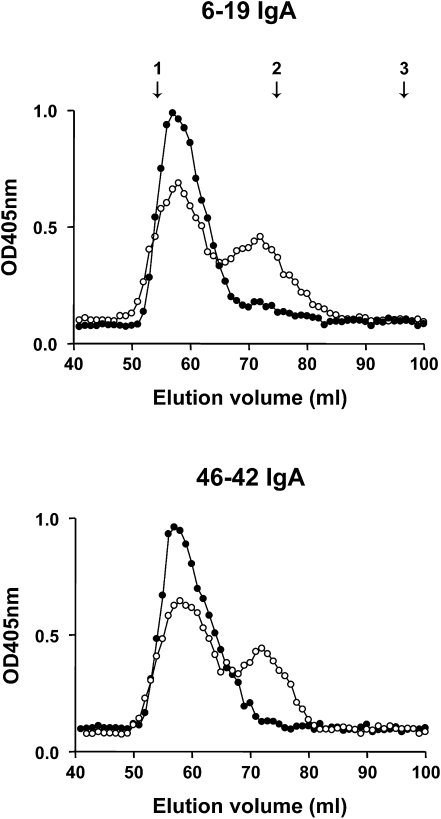
Figure 3.
Elution profiles of 6-19 and 46-42 IgA RF mAbs on Sephadex G200 gel filtration column. Relative concentrations of IgA (open circle) and IgA anti-IgG2a RF (closed circle) in each fraction, expressed as OD values at 405 nm, were estimated by ELISA. The column was calibrated with blue dextran (void volume), IgG (150 kD), and BSA (67 kD), the positions of which are indicated by arrows: 1, void volume; 2, IgG; 3, BSA.

