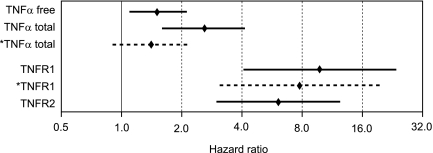
Figure 2.
Effect of each TNF pathway marker on the risk of ESRD in T2D patients during 8–12 years of follow-up. Data are estimates of HRs for an increase by one quartile in the distribution of the marker concentration. The estimates are from a Cox proportional hazard model that adjusted for AER, eGFR, and HbA1c. Other clinical covariates were not significant and did not confound the effects of the receptors. Diamonds and solid lines represent point estimates and 95% CIs for individual markers. The third and fifth lines in the figure are broken and marked by an asterisk to indicate that they represent point estimates and 95% CIs when both total TNFα and TNFR1 were included in the model. For additional details of these analyses, see Supplemental Table 5.

