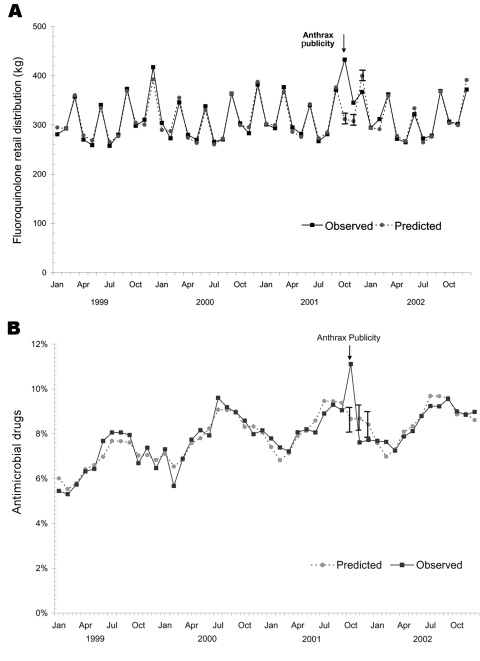
Figure 2.
A) Retail distribution of fluoroquinolone antimicrobial agents, January 1999 through December 2002. Volume was measured in kilograms. B) Actual and predicted retail distribution of fluoroquinolone antimicrobial agents as a percentage of total antibiotic volume distribution (excluding tetracyclines), January 1999 through December 2002. Vertical bars show 95% confidence intervals.

