
Figure 2.
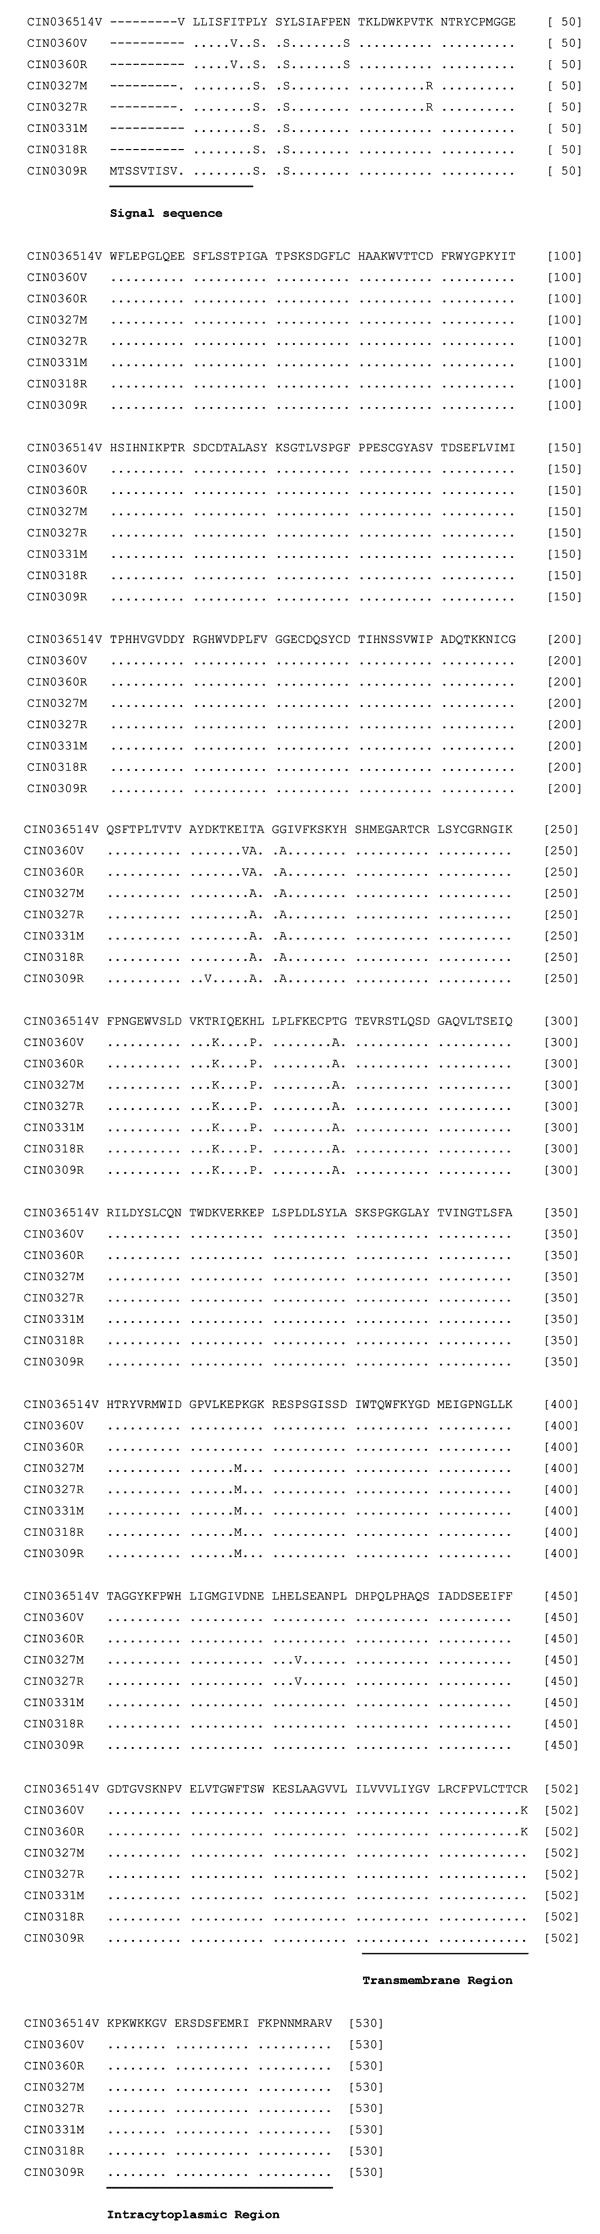
Alignment of the deduced amino acid sequences of the G protein of different isolates of Chandipura virus. For details on isolates, see Table 1. Solid bars represent signal sequence (1–18 amino acids [aa]), transmembrane region sequence (482–502 aa), and the intracytoplasmic region sequence (503–530 aa).