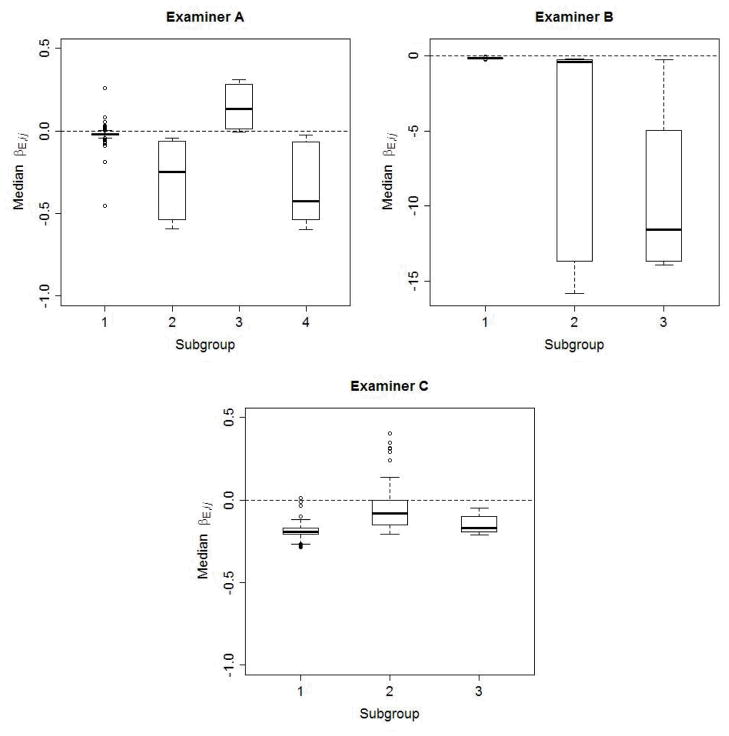
Figure 2.
Boxplots of the posterior median βE,ij for each subgroup of periodontal sites. The medians are determined from 10,000 posterior realizations. The bias effects associated with the 443 sites probed by examiner A fell into 4 subgroups; the bias effects for the 455 sites probed by examiner B formed 3 subgroups; and the bias effects for the 473 sites probed by examiner C also formed 3 subgroups. To avoid excessive compression, the scale for examiner C extends more negatively than for the other examiners.

