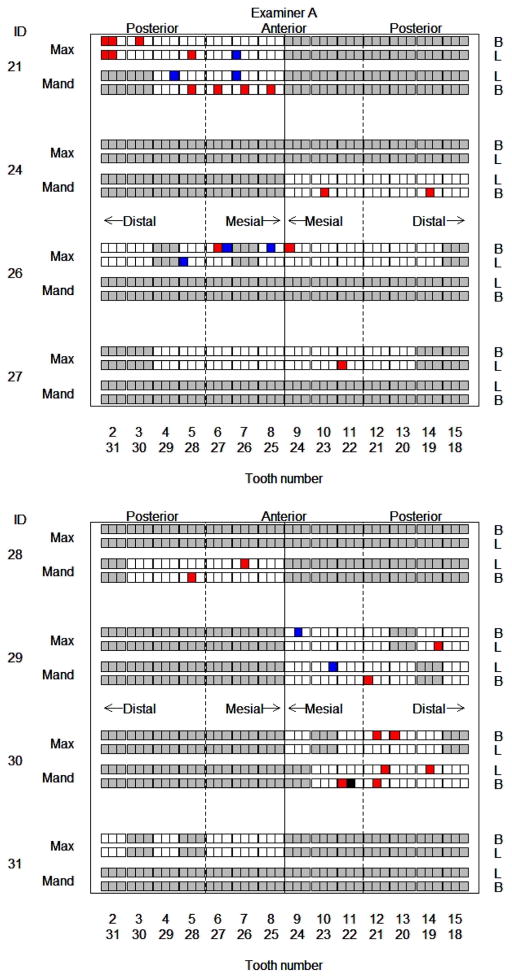
Figure 3.
Graphical depiction of subgroup assignments of periodontal sites for examiner A. Each small square corresponds to one probing site. The color of the site denotes subgroup assignment: White = subgroup 1, red = subgroup 2, blue = subgroup 3; black indicates the singleton class; and gray sites were not probed by this examiner. Site location is indicated as Max = maxillary jaw, Mand = mandibular jaw, B = buccal, L = lingual, with the relative location of the square further indicating mesial/distal.

