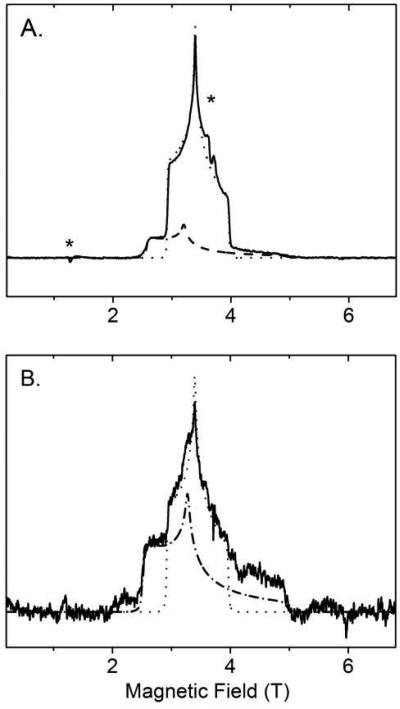
Figure 4.
High-field and high-frequency (104 GHz) EPR spectra of native (panel A) and Ca2+-depleted MauG (panel B) at 5 K with simulations. The HS heme is indicated by stars. The experimental data are shown in solid lines. The dotted line is the simulation of the LS heme in native MauG with g values of 2.545, 2.19, 1.873; the dashed line (2.89, 2.32, 1.50) in panel A presents the LS heme in native MauG derived from the high-spin heme upon freezing; The dash dotted line in panel B presents the newly formed LS* heme in the Ca2+-depleted MauG with the g values of 2.97, 2.27, 1.50.

