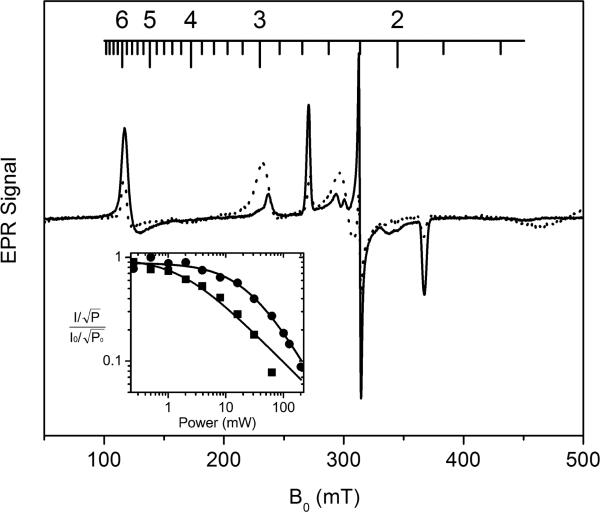
Figure 5.
X-band EPR spectra of native (dotted trace) and Ca2+-depleted MauG (solid trace) taken at 10 K. These spectra were taken with identical instrument parameters with the exception that the former was obtained with 1 mW microwave power and the latter 12.7 mW. The inset is a plot of the 10 K power saturation profiles of the major low-spin ferric heme EPR signal in native (circles) and Ca2+-depleted MauG (squares), respectively.

