Figure.
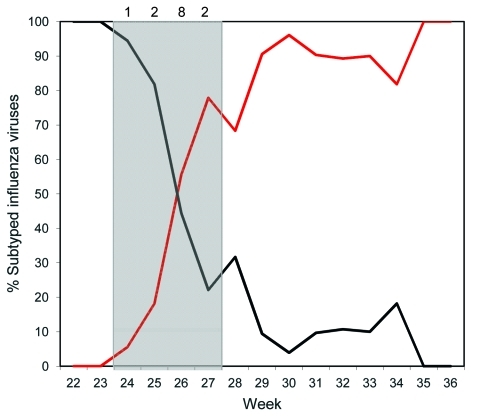
Co-infection during cocirculation of seasonal influenza A (H1N1) and pandemic (H1N1) 2009 viruses, New Zealand, 2009. Red line indicates pandemic (H1N1) 2009 viruses; black line indicates seasonal influenza A (H1N1) viruses. The gray shaded area indicates weeks in which the co-infections occurred; numbers above the graph indicate number of co-infections for that week: 1 co-infection in week 24, 2 in week 25, 8 in week 26, and 2 in week 27.

