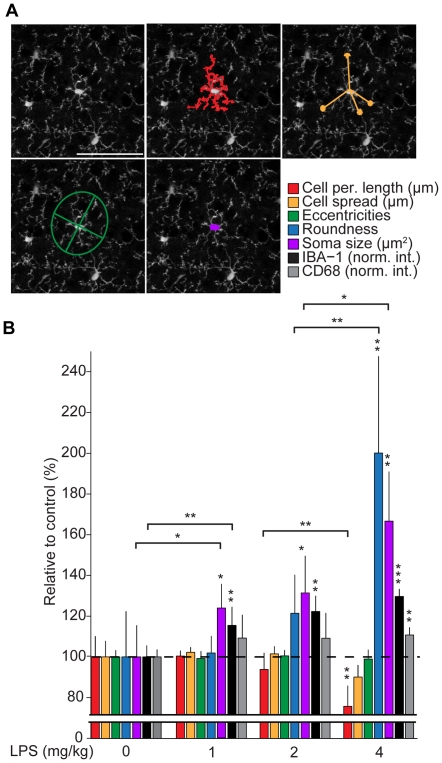
Figure 2. Morphometric parameters that quantitatively capture LPS-induced microglia morphology change.
(A) Morphological parameters defined to characterize the shape of segmented cells: cell perimeter length, cell spread, eccentricity and soma size. Scale bar equals 50 µm. (B) Relative change in microglia morphometric parameters, IBA-1 and CD68 expression as a function of LPS dose. For each LPS condition, a mean value for each morphological parameter is calculated per animal, which is then normalized to the average value for that parameter in the control group (0 mg/kg LPS). This relative value per animal is then used to calculate a mean value and standard deviation per condition, as plotted, n = 7, 6, 6 and 5 animals/condition, respectively. Asterisks indicate statistical significance compared to 0 mg/kg LPS (see Materials and Methods), those over horizontal lines indicate statistical significance between conditions.

