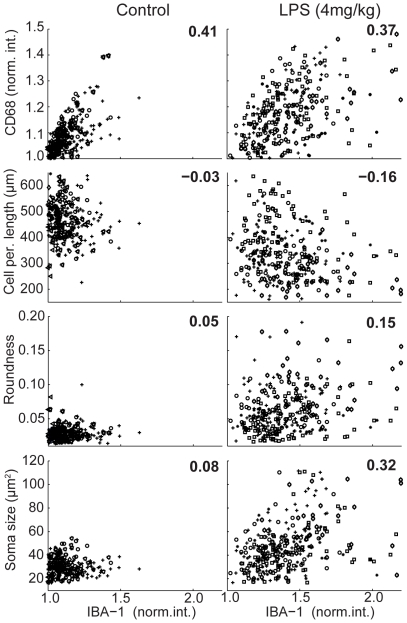
Figure 3. Correlation between morphological parameters and IBA-1 expression.
Correlation plots between IBA-1 expression and CD68 expression or the various morphometric parameters, under control and 4 mg/kg LPS conditions (n = 7 and 5 animals/group, respectively). Cell populations from individual mice are plotted in different symbols. The numbers indicates the mean linear correlation coefficient (R2) value per comparison derived from linear fits to each animal dataset within a condition.

