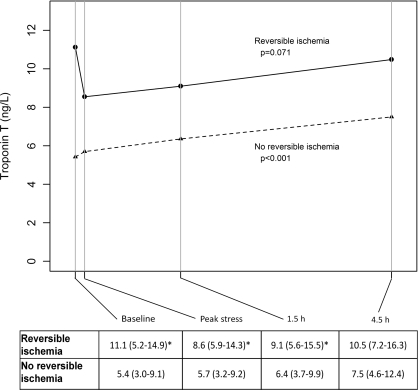
Figure 1. cTnT levels at different time points stratified by MPI results.
The Table below shows the median (interquartile range) cTnT levels at the four different time points. P values in the Figure refer to changes in biomarker levels across time points for each group. *P<0.05 for the comparison with the no reversible ischaemia group.

