Fig. 4.
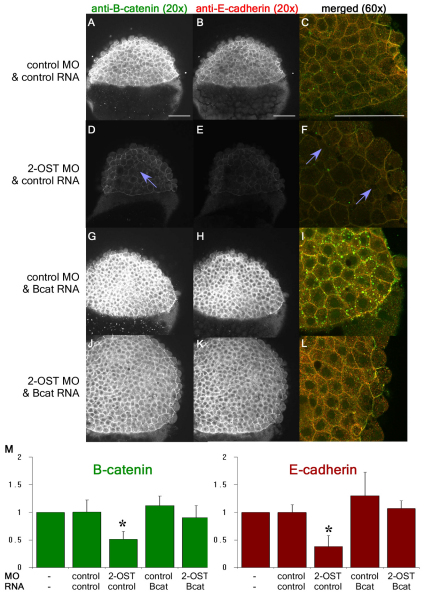
β-Catenin accumulation is dependent on 2-OST. (A,D,G,J) Single planes of z-stack at 4 hpf of β-catenin for control MO+control RNA- (A), 2-OST MO+control RNA- (D), control MO+stabilized β-catenin RNA-(G), and 2-OST MO+stabilized β-catenin RNA (J)-injected embryos. (B,E,H,K) Single planes of z-stack of E-cadherin control MO+ control RNA- (B), 2-OST MO+control RNA- (E), control MO +stabilized β-catenin RNA- (H), and 2-OST MO+stabilized β-catenin RNA (K)-injected embryos. (C,F,I,L) Merged images of β-catenin and E-cadherin for control MO+control RNA (C), 2-OST MO+control RNA- (F), control MO+stabilized β-catenin RNA- (I), and 2-OST MO +stabilized β-catenin RNA (L)-injected embryos (n=21 for each group). The purple arrows indicate regions in which adhesion is completely lost between deep cells based on dark spaces and altered cellular morphology. Scale bars: 100 μm. (M) Western blot results, comparing band densitometry at 4 hpf. β-catenin (green) levels per sample were normalized to α-tubulin levels per sample, and then WT, control MO and control RNA, 2-OST MO and control RNA, control MO and stabilized β-catenin RNA, and 2-OST MO and stabilized β-catenin RNA were each normalized to WT, using WT as a value of 1. The same was done for the E-cadherin (red) (two embryos/lane/sample, n=5 experiments). *P<0.05 for levels of protein statistically significantly different for the 2-OST MO and control RNA compared with all the other samples on the chart. Error bars represent s.d.

